SEISMOMETER CONFIGURATION REAL-TIME ACQUISITION AND MONITORING

SCREAM 3.0
SEISMOMETER CONFIGURATION REAL-TIME
ACQUISITION AND MONITORING
This is a Windows 95/98/NT based application; therefore almost any IBM-PC compatible computer suitable for running Windows 95 is suitable and Windows must be installed.
For BETTER performance, the following is recommended:
Processor: 133 MHz Pentium or equivalent
Memory: 16 Mb or more
Graphics: Local Bus Accelerated at 1024x768 resolution
Monitor: 17" or better
Serial ports: 2 (1 for mouse, 1 for instrument input)
Network card
Floppy drive
CD-ROM drive
The MINIMUM tested specification is:
Processor: 486 DX/4 100
Memory: 8 MB
Serial Ports: 2 (1 for mouse, 1 for instrument input)
Graphics: VGA
Monitor: 14 inch
Disk: Approx. 1.4 Mb
Network card
Floppy drive
Preparing the Computer
Windows 95 or better must be installed (a more stable OS such as Windows Millenium
Edition or Windows 2000 is better), a printer ( shared network printer access
is fine) and a TCP/IP network connection are very useful features to best utilize
all of SCREAM's program functions. Turn off all Screen Savers, Sleep modes and
Power Saver options. You will want to have SCREAM continuously display incoming
data at all times to see any earthquakes that may happen at any given time.
SCREAM will continue to run, storing and displaying data while the computer
is in sleep mode however, some power management options may momentarily interrupt
the serial port function causing a gap in the recording of incoming data from
thePEPP digitizer.
To Turn off Screen Savers, Sleep modes and Power Saver options:

 icon
on the screen. The following menu opens:
icon
on the screen. The following menu opens: 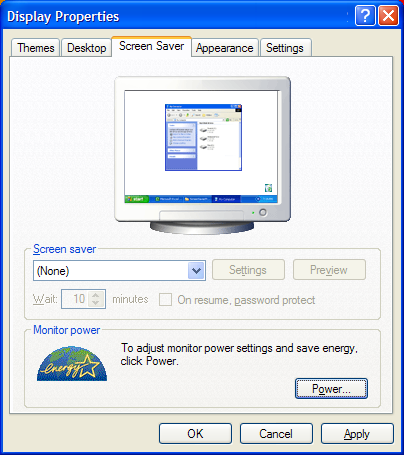
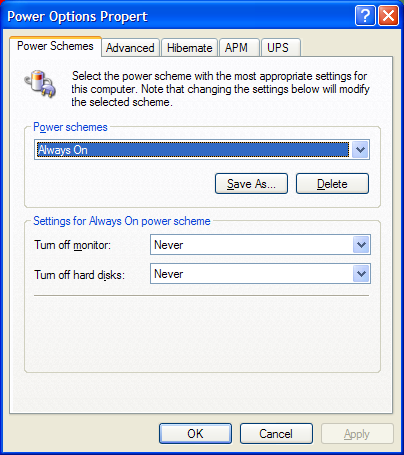
If you are still getting data gaps after turning off the
Power Management Support:
The flow control on the serial port that the PEPP digitizer is attached to may
need to be changed. Double click on Ports (COM & LPT) to to show all of
the available ports and Scroll down with the mouse and click on the port the
PEPP digitizer is attached to, to highlight it. Move the mouse pointer and click
on Properties. In the Serial port Properties window, click on the Port Settings
Tab:

Move the mouse pointer to the Flow control window and click on the down arrow.
Choose NONE for Flow Control, (the PEPP digitizer does not use flow control)
then Click on OK.
Click on the OK button to get out of the device manager.
Move the mouse pointer to the ![]() button on the lower left of the screen and click on it. Move the mouse to highlight
Shutdown and click on it. Then move the mouse to choose Restart. This will force
the settings to take effect.
button on the lower left of the screen and click on it. Move the mouse to highlight
Shutdown and click on it. Then move the mouse to choose Restart. This will force
the settings to take effect.
To Install SCREAM:
Put the PEPP CD-ROM into your computer and wait for it to auto-load. Select SCREAM from the pulldown menu, then select Install SCREAM from the list. Then click on "Install" in the upper right hand corner of the screen. Follow the instructions to install Scream 3.0.
Starting SCREAM:
Click on ![]() and then go to |Programs|Guralp
Systems|Scream3.0
and then go to |Programs|Guralp
Systems|Scream3.0
The Availiable Streams window comes up on the screen. (Note; if this is the first time using Scream, the Setup window will popup, just click OK to make it go away)

(You will not see any of the items shown here just yet)
If the Available Streams window on your system does not look similar to what it contained above, this document will step you through setting up your system and will guide you through SCREAM'S display options and functions.
This window is the main controlling window for the application. The display is split into two sections, controlled in a similar manner to the Explorer in Windows 95/NT.
The left pane shows a tree view of all sources of streams. Progressive branches of the tree reveal the originating computer, then which serial port the data is coming in, then the originating instrument. By selecting a particular node of the tree, all streams (seismic data) from that node and below are shown in the right pane.
The right pane shows stream details for each stream of seismic data within the selected source (from the left pane).
The gray bar along the top of the Available Streams Window:
![]()
File, View, Windows and Help are "pull down" menus that contain various
program functions and utilities available to the user.
The three icon buttons in the right corner of the available streams box function
the same as in WIN95
The "open box " icon button "maximizes" the program to fill
the computer screen.
The "slit" icon button "minimizes" the program off of the
computer screen. This frees up the computer to run and display other programs.
SCREAM continues to run as normal in the background, data collection and storage
continues to take place. The SCREAM icon will be at the bottom of the Windows
screen
The "X" icon button terminates the SCREAM program.
Information relating to each stream is displayed in columns. The columns indicate:
![]()
Stream ID is the Serial number of the Guralp processor box (digitizer) and
is the stream data source.
The stream ID can be re-named, to something that is more recognizable under
the setup option "Stream Mapping"
Rec. Shows whether recording is enabled or disabled
Format 8, 16 or 32-bit data format last received for that stream
SPS Samples per Second (should not change). A value of zero indicates a status
stream
End Time is the Latest time that data has been received for the stream
Date Current is the date of receive stream
RIC ‘Reverse Integrating Constant’. In effect, this is the value of
the last sample received. This is useful for reading Mass positions or other
environmental streams.
The status bar along the bottom of the Available Streams window indicate:
![]()
(This is a user controlled information display bar and is displayed only when
chosen under the View option in the Available Streams Window.)
The number of data streams.
The amount of memory currently used for stream buffering (for displaying data).
The system time. This time is the internal PC clock adjusted to UTC time (as
used by GPS, and the digitizers).
The WaveView window
This may or may not appear on the screen at the start of the program and it
may not show a wiggle trace.
Open the HELP Menu:

Move the mouse pointer to Help and left click on this button .The following
options appear:
Move the mouse to scroll down the menu options and highlight Contents.
A new window opens containing the Help files on the screen:

This is a completely separate document that is linked to the SCREAM program
to help guide you. Use the mouse pointer to click on subjects, and option buttons.
This HELP window is separate from the SCREAM program and will not affect the
operation of the SCREAM program itself. When in the SETUP menus of SCREAM and
with the Help window open, the Help menu button, will jump to the topic in question
for you. This Help documentation provides additional information that will help
guide you through the installation process and in the operation of the SCREAM
program.
Move the mouse pointer and click on the Help pull down menu and scroll down
and click on ABOUT a pop up window comes up:
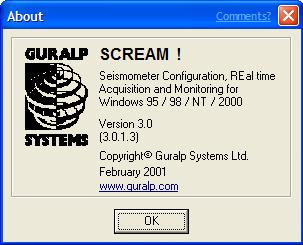
Tells you wheat version of SCREAM you are running etc. Move the mouse pointer
and click on OK
when done viewing this window.
DATA IDENTIFICATION
After you have located the PEPP sensor and digitizer in a quiet location, connected
the GPS clock and serial port data cable to the recording computer, applied
power to the digitizer and started the SCREAM program on the PEPP computer,
the first configuration and set up option to do is to set the proper Station
Identification Name internally to the PEPP digitizer. This name is attached
to the data stream that comes from the PEPP digitizer (processor box) this name
becomes a part of the serial number of the digitizer and makes the have data
unique identifier for every guralp digitizer. This prevents data from being
inadvertently mixed up with data from other digitizers at central data collection
center. The PEPP serial number is already a part of this unique name, being
able to add your PEPP STATION ID aids in quick recognition of the data source.
The above example of the Available Stream window shows in the LEFT window pane,
the PEPP digitizer is attached to com2 on the computer named GEOSCI-PEP and
has a specific System Identifier (Digitizer Name) and serial number, PPBLO-7019
This ID name is the Stream ID that is SET in MEMORY of the PEPP digitizer. This
is the unique identifier that is tied to all seismic data that is generated
by this PEPP digitizer. You MUST give your PEPP digitizer a unique name in order
for your station data to be properly identified when sending and recieving data
over the internet.
NOTE: If the right pane of the Available Streams window is blank you will need to first set up the COM port to recieve data form thePEPP digitizer. Go to the SETUP OPTIONS instructions and follow the instructions to get to the SETUP MENUS (the SETUP menu options can be done in any order) then click on the COM port tab and follow the instructions to set up the com port the PEPP digitizer is attached to. After a few moments, the stream ID should show in the Available Streams window and you can now name your digitizer.
To give your PEPP digitizer a name, use your assigned PEPP Station ID.
Move the mouse pointer to current name of the PEPP Digitizer just under the
terminal symbol and com port symbol in te LEFT pane of the Available Streams
Window (it may say FAILZ4 or WOO…) and click on it to highlight it.
With the mouse pointer INSIDE the blue highlighted section,
RIGHT Click while on the highlighted name.
A dialog box will open:
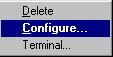
Drag the mouse pointer down to highlight Configure and click on it.
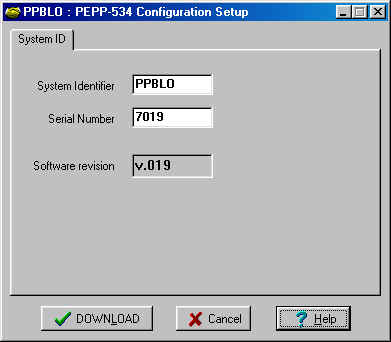
A new window will open up:
NOTE: If the program gives you an error message before this happens, you will need to configure your digitizer manualy through a terminal prompt, see instructions down below.
Move the mouse pointer into the System Identifier window and click in the white box.
Type your PEPP station name in the window provided. The Serial Number should match the serial number on your PEPP digitizer. Type the serial number in the window provided, if needed.
Move the mouse pointer and click on the DOWNLOAD button.
This sets the System Identifier name in the PEPP digitizer.
After a moment,
The PEPP station name should now appear in the left pane of the Available Streams
Window followed by a dash and the serial number of your PEPP digitizer.
If You Couldn't Name Your Digitizer With the Instructions Above
Go to the "files" Pull down menu located in the upper left corner
of the Available Streams Window, just under the words "Available Streams"
in the blue bar and click on it.
Move the mouse pointer down to highlight and click on Terminal. A dialog box
opens:

Verify the correct com port and that the Baud Rate is set at 9600. Use the
down arrow icon with the mouse to choose the correct com port and use the mouse
pointer and click in the Baud Rate window and type in the correct Baud Rate
if needed. Note SCREAM will check for the correct com port, so editing what
is in this dialog box may be unnessary.
Click on OK
A terminal session will be established between the computer and the PEPP digitizer
box:
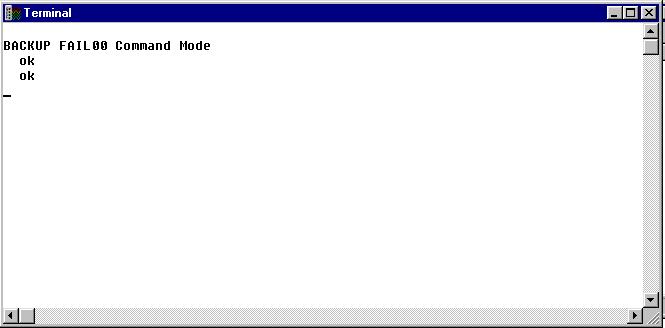
If you hit the Enter key the digitizer will respond with ok.
Some digitizers may say WO0791 701500 or PPBLO 7015 The important thing is the
words "Command Mode".
At this point, type:
ok-1 (hit enter)
The digitizer responds with:
Forth Vocabulary now available
Guralp Systems Ltd - PEPP-534 \v.20 mgs 02/02/98 ok
The system is now ready to accept your commands. type all characters, commas
and spaces exactly as written!
To change the digitizer name and or serial number, type:
set-id (hit enter)
The system responds with: asking for a system identifier name. You type your PEPP station ID followed by a comma. For example:
System Identifier? (e.g. ALPHA,) PPBLO, (hit enter)
The digitizer responds with asking for a serial number. Type your PEPP digitizer
number (found on the back of the digitizer box) followed by a comma and two
zeros.
Serial #? (e.g. 1234,00) 7015,00 (hit return)
The digitizer responds by reporting the new System ID and Serial Number:
PPBLO 701500 ok
If you make a mistake, hit the enter key and repeat these steps. Your changes will take effect when the digitizer is re-booted.
Re-boot the system: Type:
re-boot (hit enter)
The system responds with:
Are you sure you want to re-start the system (in the new configuration) - Yes/No?
Type:
y (hit enter)
The digitizer responds saying the changes will take effect in a few seconds.
Exit the terminal window by moving the mouse pointer and clicking on the "X"
icon in the upper right corner of the terminal window.
If you get: ? is undefined you have made a mistake, simply type ok-1, hit enter and re-type your commands. Sometimes the digitizer won't accept the changes on the first or second try (sometimes because of typing errors other times ???). Re-enter the process to set the id until the digitizer accepts the changes. If this does not work, install SCREAM 2.2 and use that proceedure to configure the digitizer. Still have problems? send email to: tstigall@indiana.edu
Move the mouse pointer to File and left click on this button .The following
options appear. Move the mouse to scroll down the menu options and highlight
SETUP. Release the mouse button.
The Setup window (dialog box) opens up:
The Setup Menus
This window is like "tabbed" index cards.
Clicking on a subject tab brings it to the front to view and allows changes
to be made to the settings of the SCREAM programs.
The buttons on the bottom of the Setup window:
"? Help" Brings up Scream's, Help program and explains options and
settings.
"X Cancel" Breaks you out of the Setup window without invoking changes
you may have made in Setup.
"Apply" Invokes the changes you have made and the changes are saved
to disk without exiting the Setup window.
"OK" Has the same function as Apply, except it closes the setup window,
putting you back to the Available Streams window.
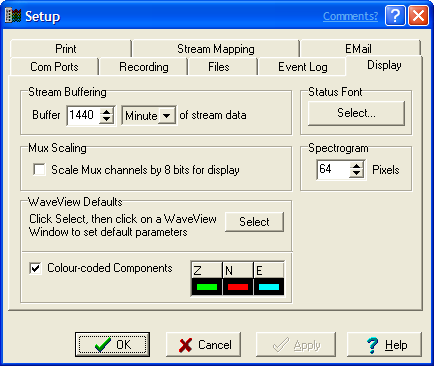
Click on the "Display" tab it will look like the setup window above:
Move the mouse pointer to the window in "Stream buffering".
Click on the Buffer window (highlight it) and type:
1440 minutes of stream buffering.
In order that the program can re-draw the wave forms, some history must be buffered in memory. This value determines how many minutes of data per stream are buffered. Note that the larger the value, the more memory is used. This value also determines the display range available during "pause mode" and in replay "pause mode". One minute of data from one stream at 16 bit compression, and sample rate 100 would use approx. 13 Kb of memory. 1440 minutes of stream Buffering uses about 1Mbyte of memory.
![]() Mux Scaling
Mux Scaling
Click in the box to check mark this option. This is useful when a "Mux"
channel is used as a calibration output.
WaveView Defaults:
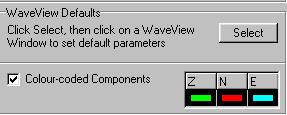
This section can be skipped, you can come back to it and make these changes
anytime during the operation of the SCREAM program.
These options allow you to choose the color of the WaveView window, the background
color and the color of the wiggle trace. The default colors are shown: the background
is black and the wiggle trace is green for the vertical component data stream.
You can change the default settings to such that the WaveView window will always
open with the colors you choose.
To change the wiggle trace color, move the mouse pointer and click on the component
"Z" for one component vertical only PEPP's you want changed,
a color palette window comes up:
The LEFT side of this window shown below will appear. If you want to choose
a custom color that is not shown in the boxes choices, move the mouse pointer
and click on:
![]()
and the RIGHT side of this window will show the color hues (rainbow) and Intensity
bar will show.

Move the mouse pointer and click on a color box to choose it or move the mouse
pointer to the "target" icon in the rainbow, click on it and hold
the button while moving the mouse around the rainbow to the color you desire
which will show in the 'Color|Solid' box. Then move the mouse pointer to the
Intensity bar Arrow, click on it and hold down the button while moving the mouse
up and down the bar to choose the intensity and release the button. Click on
"Add to Custom Colors" and this custom color will appear in a Custom
colors box in the left of the window.
Move the mouse pointer to a color box you choose and click on it.
Then Click on OK to choose this color as the default color.
Each time the SCREAM program is re-started it will use the color you chose for
the wiggle traces as the default color in the WaveView Window.
To change the default color of the background of the WaveView Window:
You must first have a WaveView window OPEN. If you do not have a WaveView window
on the screen, go to the Available Streams window, move the mouse pointer to
the Windows pulldown menu and click on it. Scroll down to highlight New WaveView
Window and click on it. A WaveView window will open up. Once you have a WaveView
window on the screen, move the mouse pointer to anywhere on the background color
of the window. RIGHT click with the mouse button and an option window will open:
Use the mouse to scroll down to choose Background Colour and left button click
on that option. The same color options box will open as above. Follow the same
procedure as above to choose the desired background color for the WaveView window.
To make this color the default color each time SCREAM is started, go to the
DISPLAY option page and click on the SELECT button. Then move the mouse pointer
(It will change to an UP arrow) to the open WaveView window and click on the
background of the Waveview window. A new dialog box opens up:
Move the mouse pointer and CLick on OK
Click on the Apply button when finished with this setup
option page.
Com Ports
CLICK on the Com Ports tab:
The Com Ports dialog box opens up:
The SCREAM software must know which com (serial) port the PEPP processor box
is attached to via the cable connection between the processor box and the computer.
Any number of serial COM ports can be opened simultaneously for data reception. To open a port, simply specify the BAUD rate desired by clicking on the port label, and selecting the desired baud rate from the pop up menu. To close a port, select (none) for the baud rate.
The following steps establishes that connection:

NOTE: The BAUD RATE MUST be set to 9600 for PEPP processor boxes.
Move the mouse pointer to highlight a com port i.e. Com1. Left click on the com port and a new window opens up: Move the mouse pointer into this window, highlight and Click on 9600.
If the computer has no other devices connected to the serial ports, repeat the above steps for all the available com ports. Otherwise you will have to establish which port to set to 9600 baud to establish a communication link to the PEPP digitizer. You can do this most easily by trial and error. Set a com port to 9600 as directed above, move the mouse pointer and click on OK to exit the SETUP window, then wait a few moments, 15 to 30 seconds for the Data Stream from the processor (digitizer) box to appear on the Available Streams window. If it doesn't show up, re-check that the serial port cable connections between the digitizer and the computer are good, make sure power is applied to the digitizer box and the LED's are blinking on the front panel. If the data steam still does not show up, go back to the Com Ports Setup menu and try another Com port as directed above and set it to 9600 baud.
NOTE:
Ports that are not available to the program are not displayed in the list. Ports
may not be available if they are not installed, or the Windows 95/NT driver
is not installed, or is in use by another program.
Note, that if a DOS application using a serial port has been run from a DOS window, and that window is still open, then the port may not be available, even though the application has terminated. Close the DOS window to free the port for Windows programs.
![]() Check mark to enable EACH
option box :
Check mark to enable EACH
option box :
Move the Mouse pointer to the boxes and check mark each of them. The PEPP digitizer
uses all of these options in its communication with the computer.
NOTE:
The PEPP digitizer uses only one baud rate so auto baud detection should be
disabled by check marking this option. Back to Naming Digitizer
Click on the Apply button when finished with this setup option page.
Click on Files tab:

The options on this page allow control over the generation and storage of files.
Base Directory:
Specifies the root directory for data files to be saved in. Files for each stream
are stored in sub directories off this root. The name of the sub-directory is
the Stream ID or the "alias" name for the stream ID.
Decide the location where you want the SCREAM data to be stored. Name the DATA directory whatever you wish. Move the mouse pointer and click to highlight the Base Directory field. Type the location in the field provided. Use a dos directory tree path format. C:\DATA Depending on your windows version or directory tree a "\" may need to preceed your data directory name. If SCREAM tells you it can't record data that the disk is full or read only you may need to add this 'slash' before your data file name..
Choose: Hours
The data files can be any number of hours long.
In the option box just to the LEFT of the HOURS ( top box of the three stacked
boxes in the middle) use the mouse pointer and click on the up and down arrows
to choose or highlight the window and type in the number of hours you want your
data files to contain. One hour data files is recommend for PEPP schools. Keep
in mind the display buffer is limited in size and having a data file that is
long may mean not all of the data can fit in the WaveView window to be displayed
when using WaveView window in Replay mode. Whether 1 hour or more is chosen
does not really matter, because the program, GCFinfo, will allow data files
to be combined and time sections "cut" to make new "Notable Event"
files of your choosing.
Granularity: The PEPP digitizer stores the data at 20 Samples Per Second (SPS).
The size of the data files can be chosen to be in Minutes, Hour files or in
Kilobytes. See the help menu for explainations of these options.
Data Format:
![]()
Choose: (.gcf) Guralp Compressed Format, this is the data format standard that the manufacturer uses that is specific to their data manipulation programs.
NOTE: SCREAM and GCFinfo can only interpret data files in GCF format. Other formats can be chosen, by moving the mouse pointer to the arrow button and highlighting one of the other data formats listed. If another file format other than GCF is chosen, all stored data can no longer be viewed (replayed) by using SCREAM or GCFinfo. Other seismic data manipulation programs will have to be used to view and manipulate the seismic data.
NOTE: Another program that is provided to PEPP Schools called GCFinfo has the option of viewing all .GCF data files. GCFinfo allows the user to combine files and "cut" data containing notable events and store it in PEPP format to upload to the Princeton database. Other earthquake data formats can be chosen as well.
PEPP PROGRAM SCHOOLS SHOULD USE .GCF FORMAT TO BEST UTILIZE SCREAM'S PROGRAM FUNCTIONS AND THEN USE GCFINFO TO "CUT" EARTHQUAKE EVENTS AND CONVERT THEM INTO PEPP FORMAT FILES.
PEPP DATA Storage Format:
The example shown in fig. 7 designates data will be stored in one hour long
files using the file names that are named by the Year, Month, Day, Hour. These
are stored in a sub directory called 7019Z4 or the "alias" name you
made for your data stream. 7019z4 is the serial number of the PEPP digitizer
from which the data originated, "Z" identifies it as the vertical
component data, that is in a sub directory called SEISDATA, which is in a directory
called SCREAM, which is located in the ‘D’ drive.
Below, is what the data files look like using formatting and .gcf, under Windows Explorer;
![]()
Each file is one hour long and each file is identified by the year, date, time and hour, with .gcf indicating the data is a GCF format data file.
Recording
CLICK on the Recording tab:
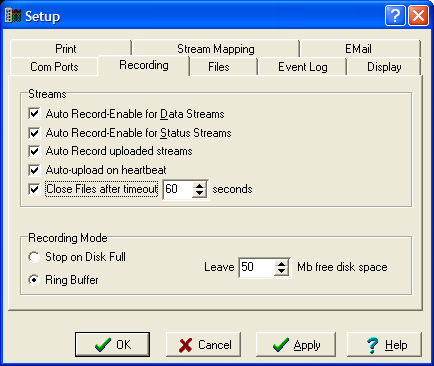
The options on this page allow control over the general recording parameters.
In the Streams section of this window:
Check mark by moving the mouse pointer and clicking on the box:
![]() Auto Record-Enable for Data
Streams:
Auto Record-Enable for Data
Streams:
This allows auto recording for the data streams.
![]() Auto Record-Enable for Status
Streams:
Auto Record-Enable for Status
Streams:
This enables all new status streams detected will have recording enabled by
default (Set to ‘Yes’). If not selected, auto recording will not occur.
Note that this does not affect streams that are already in the stream list.
The PEPP digitizer does not use the rest of the options listed. If all the
options are check marked, SCREAM
will still function normally with the PEPP digitizer. You can find information
about these options by clicking on the Help button.
The Recording Mode Section:
![]()
Specifies the action to be taken when the amount of free disk space on the recording
directory is below the pre-set level as set by the user. Use the mouse pointer
and click on either the up or down arrows to scroll to the number of Mbytes
of free disk space you want free, or click on the white box to highlight it
and type in the number of Mbytes of disk space you want left free.
How much disk space you want to leave free depends on your disk size and what other program file space you may need to run other programs on your computer. 20-30 Mbytes free is the minimum recommendation for Windows.
Choose one of the two following options:
Stop on Disk Full: will force recording to stop of data streams. SCREAM will
continue to run and display data, but no data will be stored to disk once it
is full. Choosing this option requires that the user will have to periodically
delete data files to make space available for SCREAM to have space to save new
data. Data files the user wishes to save will need to be saved or moved to another
storage medium.
Ring Buffer will delete the oldest file in the currently used directory and
SCREAM will continue to write new data files onto disk. This is the preferred
option used by most PEPP users as files that contain notable events are saved
by the user into other folders, other storage medium or SCREAM data is sent
to be saved on another network computer.
Move the mouse pointer to the option you prefer and click on the circle. A black
dot indicates the option chosen.
Click on the Apply button when finished with this setup option page. These are the minimum settings that are necessary to get the SCREAM program running displaying and storing your seismic data.
At this point you may leave the setup window and follow the Viewing Data Instructions on how to display your wiggle trace in the WaveView Window or you may continue with the SETUP procedure until all are completed.
It is strongly recommended that all of the SETUP options be viewed and set to take advantage of all of SCREAMS capabilities and to better understand the SCREAM program.
The SETUP Menu may be pulled up at any time the SCREAM program is running to
invoke or change settings.
Click on the OK button to leave the SETUP menu and follow Viewing Data with
SCREAM to view your data now.
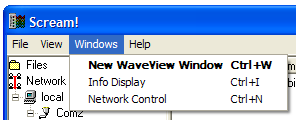
To open the Network Control settings, click on Window, then click on Network Control from the Availiable Streams window:
You will then get this window:
If your PEPP computer has an Internet connection, the following options can
be allowed:
If a TCP/IP network connection is available, blocks of data can be sent and received over a network.
These options enable any network connected PC that is running the SCREAM program
to get the data stream from any network connected PC that is attached to a PEPP
Digitizer.
These options allow any number of computers to connect to the local Guralp system
computer and "pull" data from it without interrupting local data storage
and display. The "pulled" data received by a remote computer running
SCREAM can be displayed and stored independently.
Also, multiple data streams from different network connected PEPP stations can
be received by one computer.
This allows data streams from a network of remote sensor locations to be collected
at one central computer.
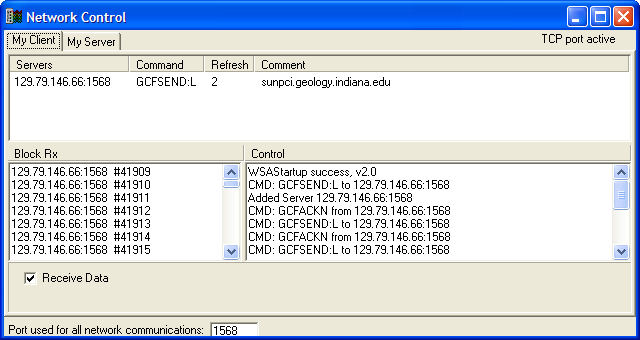
Check mark:
![]() Receive Data
Receive Data
This allows the SCREAM program to receive stream data from the network. When
the above option is check marked, any number of computers on a network that
are running the SCREAM program can receive the PEPP computer's stream data this
way. SCREAM’ s functions and utilities work the same as with data coming
from a serial port, thus allowing the possibility to display seismic data and
allowing for multiple data storage locations to take place on other computers,
besides the PEPP computer (the computer to which the digitizer is attached).
SCREAM can also receive stream data
from the network from other PEPP digitizers; each identified in the Available
Streams Window by their unique Stream Id and name.
Port Number: 1568
NOTE: Each computer will only receive data if it is on the same port number
as the PEPP computer(s). The port number
acts as an access number. Data can only be shared between computers that have
the same port number. This option can be used to isolate PEPP networks from
each other.
This number must be a four digit number.
Choose: Port Number 1568 or the port number as specified by your HOST institution (This is the number chosen by Indiana University PEPP Instrument Center). Move the Mouse pointer to this field, click in it and type 1568.
Note: For PEPP computers to be able to send and receive stream data to each other, the Port Number MUST be the same for ALL computers and the above options must be check marked.
Sending PEPP Data Out Via the Internet
The above settings allow data to be passed between systems running SCREAM over the internet. The next section allows a mechanism where Guralp Systems running SCREAM can send data to other types of computer systems that act as a central data collection point. The data collection center may be a UNIX or other operating platform computer that usually runs powerful data processing software to aid in the management of data storage and retrieval.
Note: SCREAM sends data out to the network in a compressed format in single
data packets about once every 15 seconds. Sending out stream data to a specific
destination or in broadcast mode functions independently of local data display
and storage and this process occurs independently of data being passed in "Pull"
mode between computers running SCREAM.
See the help section in SCREAM for more information on these functions.
First, open Network Control, by selecting Window|Network Control:
Then Click on the My Server tab:
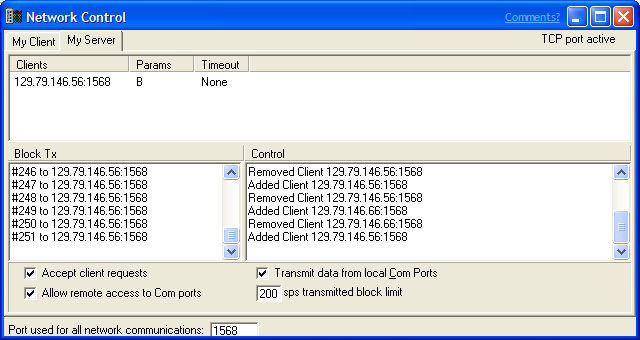
To Send data to a specific computer:
Checkmark all the boxes:
![]() Accept Client Requests
Accept Client Requests
![]() Allow Remote Access to Com ports
Allow Remote Access to Com ports
![]() Transmit data from local Com
Ports
Transmit data from local Com
Ports
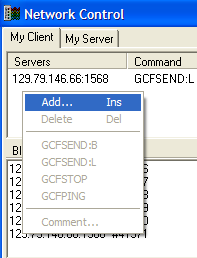
Then right-click in the top blank white space, and select Add..:
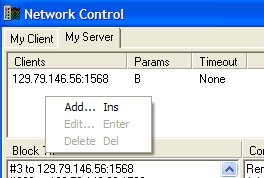
Then this box will pop up:

Enter the IP address of the client, followed by a colon and the port number, as shown above.
Then Click OK, and it will apear under clients and you will start sending data blocks to that IP address.
NOTE: The Indiana University Instrument Center has a UNIX computer set to
receive stream data and save the data continuously. Any PEPP station running
the SCREAM program and has an internet connection is welcome to send data to
IU.
The Indiana University PEPP Instrument Center is storing all data that is being
recieved and has a unique data processing progrm running to analyize the data
signals and redisplay all PEPP stations together being recievedon one display
window. This window can be viewed by PEPP schools, see the additional documentation
that was provided to PEPP schools or send mail to: PEPP@indiana.edu for more
information.
To send your station’s stream data to Indiana University, add 129.79.146.56:1568 as a client under My Server, if you send data here, please send an email to tstigall@indiana.edu. Please name your digitizer, Tell us your Station Digitizer Name and your digitizer serial number (Unique system Identifier) in the email. This will help us find your data stream and enter into our data storage management system.
When done setting up clients, click the X button on the top right of the window to close Network Controls.
The Event Log
Enter Setup from the Availiable Streams window by choosing File|Setup..
CLICK on the Event Log tab:

The Event Log setup dialog box opens up:
The SCREAM program creates an error log of problems that might occur.
Two different types of events are logged: those that are specific to an incoming
data stream and those detected or generated by SCREAM itself.
By default, all events are recorded in a file called ‘error.log’
Choose:
![]() Enable Event log
Enable Event log
To select which of the error conditions are logged, select or clear the appropriate
box. To do so, by moving the mouse pointer to the white box and clicking in
the box.
All error event options Note: not all of these error reports apply to the PEPP
system and will never be generated whether selected or not. See SCREAM’S
HELP menu for a detailed description of each of these conditions.
![]() Log Files Option:
Log Files Option:
File for each data source: If selected, then each log message is recorded in
a different file, depending on the type called
Scream.log . This file is automatically generated by SCREAM and contains other
helpful diagnostic events pertaining to the SCREAM program. These include, whenever
the Application starts and stops, etc.
![]() Limit to:
Limit to: ![]()
If Scream.log is selected (check marked), when any of the above files reaches
the specified size (n) Kb, the file will be renamed to ‘.OLD’, and
a new ‘.LOG' file started. Any existing ‘.OLD’ file will be discarded.
Move the mouse pointer to the window and click to select it or click on the
arrows to scroll or type in the desired file size.
Directory:
![]()
Type the directory location for these files to be stored. This can either be
typed in, by moving the mouse pointer and clicking in the window provided or
by selecting from the ‘Browse...’ option.
The default location is C: Windows \ Temp
Click on the Apply button when finished with this setup option page.
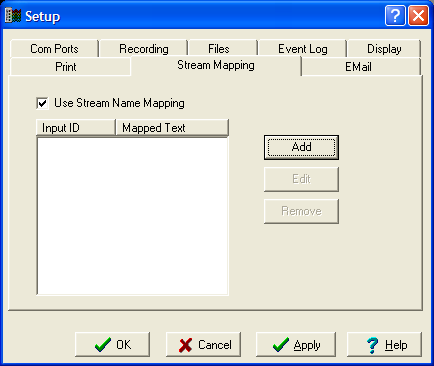
CLICK on the Stream Mapping tab:
This option allows the user to rename the stream ID for each data stream in
the Available Streams Window. This is particularly useful when multiple PEPP
stations are being collected at one computer to give each data stream an easily
recognized identity rather than just a short code name and serial number to
go by. This step is optional. If you do not want to rename the data stream,
skip this option by clicking on the OK button.
NOTE: This option does NOT change the Unique SYSTEM IDENTIFIER of the PEPP digitizer
you set in the "Name Your Digitizer" instructions. The Unique System
Identifier for each PEPP digitizer is still the name that is a part of each
data file and cannot be changed.
Stream Mapping allows the user to set ‘aliases’ for the labels of
incoming data streams.
This "alias" once set ,will appear in the Available Streams window
(right pane) as the data stream name. The name will also be used in the WaveView
windows, and on page printouts.
CHOOSE: ![]()
Move the mouse pointer and click on the white box.
After Stream Mapping is chosen, the Setup window changes to look like the tabbed
stream mapping window above.
NOTE: Certain characters cannot be used in the data stream name you choose. The mapped text is also used to generate the directory name for the recording of the data stream. This restricts the range of characters than can be used.
The following characters are not allowed in file names:
\ / : * ? " < > |
Click on: ![]()
Move the mouse pointer and click on it.
A new window will open up:
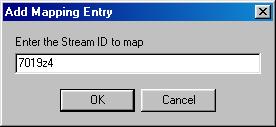
Move the mouse pointer into the field provided click in it and Type the stream
ID from the Available Streams window you want to change.
Click on OK.
A new window opens.

Move the mouse pointer into the field provided click in it and type the new
name or "alias" you want it to be.
Keep the number of characters too less than 8 because the labels in the WaveView
window automatically scale down in size to fit in the panel. If the ID name
is too long it could make long text appear too small to read.
Click on OK
The Steam Mapping window now displays the "real " stream ID and the
"alias" you assigned to each stream ID for reference in this window.
You can can add or delete alias names for as many streams as you prefer.
To remove a mapping or alias name, select the mappings to remove, by moving
the mouse pointer to
the input ID and highlighting it. Then either click the ‘Remove’ or
use the ‘Delete’ button.
To edit a mapping, rename it, move the mouse pointer to the Input ID you want
to change and
select and click ‘Edit’or double click on the name.
The "new name window" will open up and allow you to change the name for the Stream ID.
NOTE: When using an alias, SCREAM will use the "real " identifier
(stream ID or PEPP digitizer name in) all internal referencing (this prevents
data from getting mixed up or separated from it's true digitizer source) thus,
some of the sorting options in the Available Streams window will not function
in the same manner when using Alias names. This is a minor inconvenience when
you have multiple data streams coming in and wish to easily recognize the data
source.
Go to SCREAM's HELP menu for more information about STREAM MAPPING.
Click on the Apply button when finished with this setup option page.
CLICK on the Email tab:

The SCREAM program can send alert email to a specified user to notify them of chosen significant events in the operation of scream or the instrumentation.
NOTE: This page is not visible if a suitable TCP/IP network is not installed.
To implement this option: Move the mouse pointer and click in the field of the SMTP (Simple Mail Transfer Protocol) Server box enter a server name or IP address for outgoing email.
If you don’t know this address or IP number ask your Computer Support
Person.
Recipient:
Move the mouse pointer and click in Recipient box and enter the email address
that the messages are to be sent to.
Check mark:
Events to Monitor: Move the mouse pointer to the boxes and click on them to
choose the "Events to Monitor" that you wish email notification for.
Note: not all of these events apply to the PEPP system and will never be generated,
whether selected or not. See SCREAM’S HELP menu for a detailed description
of each of these conditions.
Click on the Apply button when finished with this setup option page.
Click the Print tab to view the printing options:
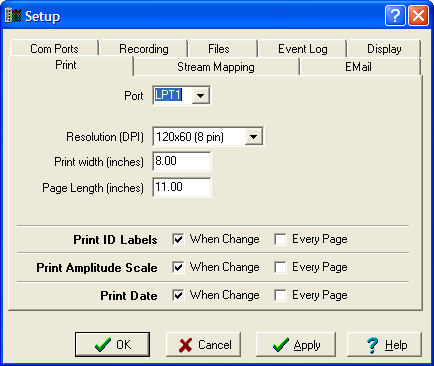
To allow a continuous printout of the wiggle trace, this option, requires an
Epson type printer be attached to the parallel port of the computer running
the SCREAM program.
A Windows printer driver is not required for continuous printout, since the
direct printer control
uses Epson ESC/p commands.
Click on the Help button for more information about this option.
Click on the OK button.
The SCREAM SETUP options are now complete!
The SETUP Menus may be pulled up at any time the SCREAM Program is running
to invoke or change settings.
The right pane of the Available Streams window should show two data streams,
as shown above, one for the GPS data stream and one for the seismometer data
stream.
To show all of the data streams in the right pane of the Available Streams window,
move the mouse pointer and click on a branch and left click on it. From that
selected point, all data streams from that branch and below are shown in the
right pane.
The Seismometer data stream is labeled INDIANA U in the example shown. If you
haven't given your data stream an "alias", the seismic data is
labeled with the system Identifier name as the Stream ID which is the PEPP serial
number with "Z4" on the end.
i.e. 7019Z4.
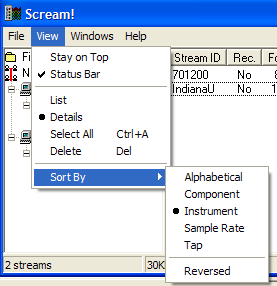
The View pulldown menu in the Available Streams window gives a number of ways
to view information displayed:
Stay on Top keeps the Available Streams window in the foreground , keeping all
other windows such as WaveView windows behind it. Don't choose this option.
Status Bar "checked" displays the info in the bottom "grey"
section of the Available Streams window. List shows only the Stream Id names
in the window, where Details shows all information. Select All and Delete do
just what they say to the Data streams in the Available Streams window and Sort
By allows you to choose a number ways to list the order of the Data streams
in the Available Streams window.
The "status" stream labeled 701200 contains a text file that logs program information. Status stream 701200 is a GPS log file and also records re-syncs and reboots and other information useful for diagnostic purposes. To view the contents of the GPS data stream:
Move the mouse pointer and click on the Stream ID that ends in 00 (in this case 701200). Press the left mouse button (left click) to highlight the data stream.
Press the right mouse button and a dialog box will open.
Scroll down with the mouse and highlight VIEW and left click on it.
A text file will open up and lots of information is available, such as the number
of satellites it sees and the drift of the clock, PWM and the angle of the satellites
the GPS sees in the sky is listed.
SCREAM will even calculate the latitude, longitude and elevation of the GPS
clock’s location periodically within the hour.
These are "quick fix" locations with the Lat. and Long. fix accurate
to roughly 5 meters.
Move the mouse pointer to the "X" icon in the upper right corner and
click on it to close this window.
The WaveView window
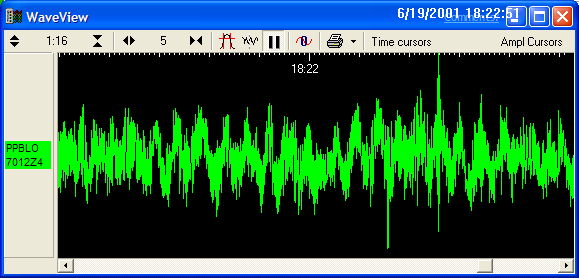
If there is a WaveView window on the screen, move the mouse pointer to the WaveView window and click on it to bring it to the foreground. If there is no WaveView window on the screen here are three ways to do it.
Opening WaveView Windows
One way to open a WaveView window is to move the mouse pointer to choose it
form the pull down menu in the Available Streams window labeled Windows.
Click the mouse button on Windows, then move the mouse button down to highlight
New WaveView Window and click on it.
The WaveView window will appear on the screen but it will not have a data stream
displayed in the window.
The data stream, 7019Z4 or Indiana U in this example, must be moved into this
window in order to view the wiggle trace.
Go to the Available Streams window and "drag and drop" the data stream
In the RIGHT window pane, into the WaveView window.
To "drag and drop", move the mouse pointer to the data Stream ID and click on it to highlight it, while holding down the mouse button "drag" the data stream by moving the mouse, into the WaveView window field and release the mouse button "drop".
Note: You may need to "arrange" the windows around on your computer screen on order to "drag and Drop" from one window to another. You can use the "minimize" button to close windows but leave them open and will show on the task bar on the bottom of the screen or use the "X" icon on the upper right corner to close the windows
Another Method to Open a WaveView Window WITH a Data Stream
The second and easier way to get the data stream to show as a wiggle trace in
a WaveView window is:
Move the mouse pointer to point at the Stream ID in this example, Indiana U
and click while ON it to highlight it, then Right Click while the mouse pointer
is inside the of the blue highlighted area of the Stream ID and a dialog box
opens up:
Move the mouse pointer down to highlight View and click on it.
This operation simultaneously opens a WaveView window and puts the data stream
in it.
The other options in this dialog box will start or stop recording of the data stream to disk or delete the data stream from the Available Streams window.
Another Method to Open a WaveView Window WITH a Data Stream
The third and EASIEST way to open a WaveView Window with SCREAM 3.0 is to move the mouse pointer to the data stream and "Double Click" on it. A new WaveView window will open with the data stream in it.
Changing the size of windows
The size of WaveView windows can be changed by moving the mouse pointer to any
window frame edge and the mouse pointer icon will change to an "opposing"
arrow icon. With the opposing arrow icon, click and hold down the mouse button
and "drag" the edge in and out by moving the mouse. Click on the "Open
box" icon in the upper right cornerof the WaveView window and the WaveView
window the fill the screen. You'll have to click on the reduce button to be
able to see and open other windows on the screen.
To Arrange the Windows on the Screen
Simply move the mouse pointer to the BLUE bar on the top of each window, then
click and hold the mouse button down while moving the mouse. This will move
the window to any position you want it on the screen. You can do this for any
window that is open on the screen. Click on any part of any window to bring
it to the foreground. If the WaveView window stays behind the Available Streams
window, move the mouse pointer to the Available Streams window and click on
the View pull down menu scroll down and click on and "un-checkmark",
'Stay On Top'.
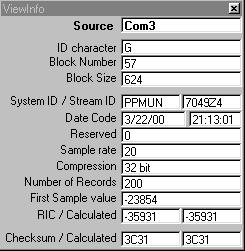
The Info Window
Information Window (ViewInfo)
Use the mouse pointer and click on the Windows pulldown menu. Scroll down to
highlight and choose Info Display, a new window will open: This is an information
window that displays what is going on during the data processing of SCREAM data.
Eack block of data gets processed and checked and any errors get logged in the
appropriate log files.
Every incoming block is decoded and the header information is displayed in this
window. A number of checks for validity are made, and any fields which appear
invalid are shown in red. Consult SCREAM'S HELP menu for more information about
this window.
To close the window use the mouse pointer and click on the "X" in
the upper right corner of the window.
Viewing Data
The WaveView window allows the user to view real-time seismic data "on-the-fly"
as it is processed and stored by the SCREAM program. The user can change the
time scale, change the amplitude and filter the wiggle trace, any time and "on
the fly", without interrupting the data recording process.
NOTE:
Any number of WaveView windows can be opened and any single data stream can
be viewed simultaneously in many different windows and different data streams
can be viewed in one window or in different windows all at once.
To open additional waveView windows REPEAT any one of the processes described
above to open several different and independent WaveView windows.
Note: The windows will be placed directly ON TOP of each other if the WaveView
window is not moved and you must click on the top one and "drag" it
to another location on the desk top to reveal the WaveView window beneath it.
The data that is displayed in the WaveView window is completely separate from
the recording process. You WILL NOT destroy the recording process while in the
WaveView Window.
For each WaveView window that is opened, data must be buffered in in order to
display it. Thus you will find at times there is not a large data stream to
view at all times. This is because the buffer is in th eprocess of filling or
it was full and has started over with new data.
Use the mouse button to click on different buttons to see what each does. A
small descriptor will show momentarily when the mouse pauses on a button.
![]()
Consult SCREAM's HELP window, click on WaveView, for detailed information about the WaveView window options.
Amplitude: ![]()
The magnification of the wiggle trace can be increased, by clicking the mouse pointer on the opposing arrows button or decreased by, clicking the mouse button on the converging arrows button. to change the amplitude scale anytime and "On-the-fly" in the WaveView window move the mouse pointer on the arrow buttons and click on them as many times as desired to ge tthe amplitude desired.
The relative magnification ratio is shown by the numbers displayed between
the two scale buttons which are "counts".
For PEPPV sensors the conversion factor to use is:
Sensor Sensitivity: 1206V/m/s
Output sensitivity: 2 x 10 e-9 m/s/count back to top
Time Scale: ![]()
The time scale can be modified by zooming in or out.
By zooming in, clicking on the opposing arrows (spreads out the time scale),
provides an overview of the display over several hours may be seen.
Zooming out, clicking on the converging arrows (squeezes in the timescale),allows
anything down to a few seconds of data to be studied in detail.
This can be useful for estimating frequency (period) of individual waves.
The relative scale factor of the time display is shown by the digit displayed
between the two scale buttons.
The appearance of the entire display can be adjusted by using both the Wave Amplitude and Time Scale buttons.
Band pass Filter :![]()
Click on it to select or unselect, the filter.
The filter option allows a band pass filter to be applied to the stream wave
forms as they are drawn.
In this version of SCREAM, this filter is fixed at:
The corner frequencies of, 0.1 and 0.9 of the nyquist frequency of the stream.
This filter is useful when displaying a broad band instrument, when long period
signals are preventing a ‘flat’ display.
Pause: ![]()
This control will stop the screen display from advancing, but SCREAM will continue
to record seismic data into memory.
A scroll bar appears at the bottom of the window, which can be used to move
up and down freely within the stored waveform. You can scroll back to see what
has moved off the window display. Pausing, in conjunction with the time scale
and amplitude buttons can be used to closely examine any part of a recently
received wave form.
The range covered by the scroll bar is the data held within the memory buffer.
You can "blow up" any section of the wiggle trace while paused by
clicking and dragging the mouse pointer over the desired location. Move the
mouse pointer to a location a little before and above or below the desired section
of the wiggle trace you want to "ZOOM IN" on. then click and hold
the left mouse button down while dragging the mouse, a growing box will show,
to "BOX" in the desired section you want blown up. Release the mouse
button. This will "blow up" that section. The actual magnification
will be shown in the time scale window.
To restore after enlarging, simply click onto the "zoom out" (opposing
arrows) time scale button several times as needed.
To return to the real-time display, click on the Pause button again.
![]() Clicking on this button removes
any DC offset that may be present. The output from an instrument can, and usually
does contain a constant DC voltage. When this output is digitized, it is represented
as a numerical offset which is not usually of any significance. In order that
wave forms be displayed on a large scale, this offset must be compensated for.
This is done by subtracting a constant from each sample as it is plotted. This
function affects only the view in the current window, and only to wave forms
which have not been locked. The offset is calculated as the average value for
all visible data for each stream.
Clicking on this button removes
any DC offset that may be present. The output from an instrument can, and usually
does contain a constant DC voltage. When this output is digitized, it is represented
as a numerical offset which is not usually of any significance. In order that
wave forms be displayed on a large scale, this offset must be compensated for.
This is done by subtracting a constant from each sample as it is plotted. This
function affects only the view in the current window, and only to wave forms
which have not been locked. The offset is calculated as the average value for
all visible data for each stream.
The Print ![]() button sends a page
printout of the WaveView window as it is displayed on the screen. The printer
must be set up through Windows.
button sends a page
printout of the WaveView window as it is displayed on the screen. The printer
must be set up through Windows.

The horizontal (time) and vertical (Ampl) measurement cursors can be used to
take readings from a PAUSED wave form display. A BLACK Waveview window background
is best with a LIGHT color wiggle trace. You can change the colors instantly,
the instructions on how to change the colors is described earlier in this document.
Click on the ![]() button and a small
white ‘box’(it's green here) appears at the bottom or left of the
WaveView window area for the time measurement.
button and a small
white ‘box’(it's green here) appears at the bottom or left of the
WaveView window area for the time measurement.
Click on the ![]() button and a white
box appears on the upper left of the window.
button and a white
box appears on the upper left of the window.
To measure the time and amplitude cursors and get readings, Click on a box,
for instance the time cursor box ,and hold down the mouse button to "drag"
the box and time line to the desired section of the wiggle trace. Go back and
get the second white box and click and drag it to the desired section you want
to measure. The area between the two lines is what is measured and displayed
on the upper task bar of the WaveView window.
Do the same cursor "drag and drop" procedure, for the Amplitude cursors
to get an amplitude measurement.
A measurement readout is displayed on the upper tool bar of the window:
The left reading is the time measured in seconds of time between the vertical
cursors. The accuracy of these readings depends on the current scaling factor,
since at large scales one pixel may represent several seconds. The reciprocal
value, the frequency, is also displayed.
The right reading is the difference in counts between the top and bottom cursors.
If the conversion factor of the digitizer is known, this value can be used to
determine the input voltage to the digitizer that value is given in the above
text.
Any number of WaveView windows can be opened and any single data stream can
be viewed simultaneously in many different windows
The advantage of having your single data stream viewed in multiple WaveView
windows is you can view them with different time scales, amplitudes and filter
options simultaneously on the screen. You can close any and all WaveView windows
at anytime.
The WaveView window data stream display is completely independent of the data recording process where raw data is stored continuously in hour long files.
Multiple Wave View Windows
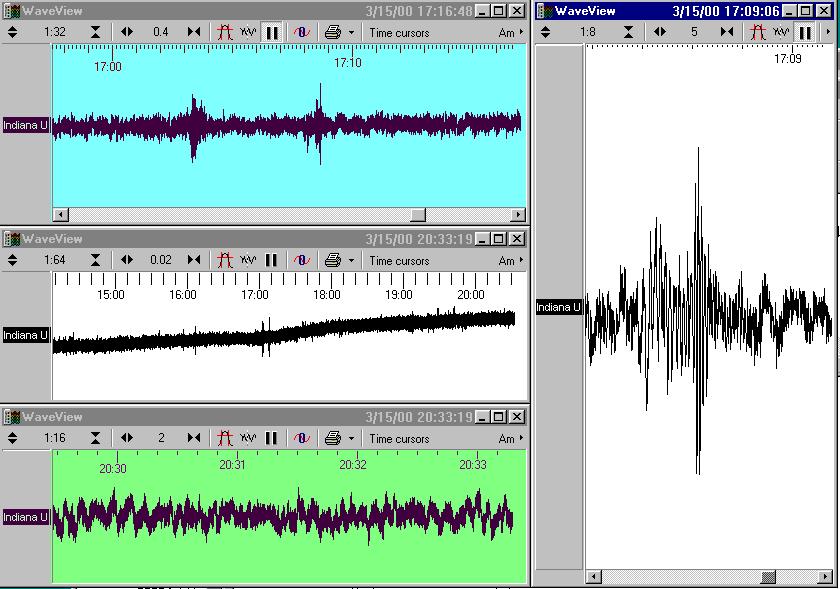
The above example shows four WaveView windows opened with all using the same
data stream simultainiously. The windows have been opened individually using
any of the methods described above and moved about the screen. Each was sized
and moved individually to fit the example shown. Each window is displaying data
differently and independently of the other. The top shows a paused window of
~ 20 minutes duration. The second shows over 7 hours of data, the third, a 4
minute window and the right window shows a paused window, one minute in duration
showing a distrubance that was recorded. All of these WaveView windows show
the current data that is held in the display buffer.
Seismic data is stored in hour long files in parallel to data that is placed in the display buffer. These "historical" data files can also be viewed and manipulated without fear of destroying the raw data by using SCREAM's REPLAY mode. How to view historical stored data files will be covered in a section called REPLAY FILES.
To manipluate data being viewed in a WaveView window, move the mouse pointer anywhere on the window desired and click on it. The top bar of the window changes from grey to blue indicating the window is chosen and is 'active'. For windows that are layered behind one another, moving the mouse pointer and clicking anywhere on the window desired, brings it into the foreground and makes it the 'active' window. Clicking on the Top BLUE area of the WaveView window and "dragging the mouse" (moving the mouse with the left button pushed down) allows you to move the window around the screen.
To change the size of the WaveView window, move the mouse pointer and pause on any edge of the WaveView window, the mouse pointer will change to an 'opposing arrow' icon. "Click and drag" the 'opposing arrow' icon in or out, to move the window edge to the size desired. Do the same for for any edge of the window to achieve the desired size.
For EACH WaveView window open, the whole data stream buffer, as dictated by
the size that was set in the "display" Setup option menu,(999 minutes
in
this case) is available to view and manipulate.
For every WaveView window that is open, all are activly updating with new data
as it comes in.
Every WaveView window displays the Date and Current Time on the top of the window.
How much of the data stream that is shown in the WaveView window depends on the time scale and amplitude settings for each window and how big the WaveView window is set, if it is full screen size, 'maximized', the entire buffer of 999 minutes can be up on the screen. If the WaveView window is standard size, it can display up to 7 hours of data in the window.
In the example shown, the light blue or top WaveView window and the large WaveView
window on the right, show a "paused" display.
When a display is paused, by pressing the ![]() button, a scroll bar appears on the bottom of the WaveView window.
button, a scroll bar appears on the bottom of the WaveView window.
![]()
This Scroll bar works much the same as used in other Windows utilities such
as WORD where only parts of a document can be viewed on the screen at a time.
Using the scroll bar allows the user to bring into view different sections of
the document.
Each WaveView window scroll bar works much the same way and how much of a given
data stream section can be viewed in the WaveView window is dictated by the
time scale settings of the specific WaveView window being used.
Pausing the data stream and using the scroll bar, allows the user to bring
into view, the specific time section of the data stream desired.
To pick a certian section of the data stream to view in the WaveView window,
use the mouse pointer and click and hold, while dragging the square button to
any position in the slider field. Releasing the button moves the WaveView window
to the chosen section of the data stream.
The Square button allows user to scroll very fast up and down the entire data stream bringing sections into view. If 7 hours of stream data is buffered in, then moving the scroll button to the middle of the grey field puts into view, the section of time 3.5 hours into the data stream. Moving the Scroll button to the far left of the grey field, brings into view the first minutes of the data stream buffer.
Clicking the mouse pointer in the Grey field on either side of the slider button,
increments the data stream buffer into view in TEN second "chunks"
at a time.
Clicking on either Arrow on each end of the slide bar increments the data stream
into The WaveView window, ONE second at a time.
Pausing a WaveView window allows an option to "Blow Up" a section
of the wiggle trace.
This allows the user to immediately take a closer look at a section of time
that contains a disturbance or event.
To blow up a section of time for a close up inspection, move the mouse pointer
and click on the PAUSE button.
Use the time and amplitude buttons to adjust the amplitude and time scale, to
do this quickly, use a very close time scale, tens of minute or 1/2 hours or
more.
Use the slider button to move up or down the data stream to bring the disturbance
onto view.
Move the mouse pointer to an area just prior to the disturbance AND above or
below the wiggle trace.
Click and hold down the mouse button AND drag the mouse over the disturbance.
Lines appear allowing you to "BOX" in the area.
Release the mouse.
The WaveView window will immediatly "blow up" the section that was
"boxed" in to fill the window. Use the amplitude button as needed.
This "Zooming In" in to blow up time sections can be repeated multiple
times to zero in on P and S arrivals. The time and amplitude curser measurements
are a great feature to use when zooming in to help calculate arrival times.
To go back or Zoom Out , use the mouse pointer and click on the "pointing
in arrows" multiple times as needed to get back to the scale you want.
Click on the PAUSE button to "unfreeze" the WaveView to allow into
view new data as it comes in.
"Right Click" Options in the
WaveView Window
Moving the mouse pointer anywhere in the field of the WaveView window and "RIGHT"
click on the window produces a task window which allow you to make changes to
the WaveView window. Thus you can change the WaveView colors to be different
from the default colors you set in the SET UP options.
Scroll down to highlight the option desired and click on it.

Colour changes the color of the wiggle trace.
Backgound Colour allows you to change the background color of the WaveView
window.
A color pallette window appears and you can choose or customize a color of your
choosing as described in the Display Set Up instructions.
Spectrogram gives a "Fast Fourier Transforn" (FFT) plot of
the wiggle trace. This is best viewed with a white background window.
Delete and Clear Window clears the WaveView window but keeps it open.
If you "drag" a new data stream into this window, the "right
click" options are
disabled.
To restore the "right click" options, close the WaveView window by
using the X button and open a new one.
Locked Offset disables the "null" button and locks the present
seeting of the dc offset of the data that is being displayed.
Label lets you assign a unique name to the WaveView windows to help you
identify the data stream or describe what you are doing in the WaveView window.
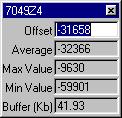
Details opens a window information about the data stream as it is being
fed into the WaveView window. The Offset window can be changed by the user to
add a DC offest to the wiggle trace, in a positve or negative direction.
The Offset Window
This option is useful if there are two data streams or more in ONE WaveView
window and you wish to bring them closer together or even "overlay"
one wiggle trace on top of another.
Use trial and error and type in a value and hit the return key to invoke it,
see where it moves the wiggle trace and try again until you get the wiggle trace
where you want it displayed in the WaveView window.
Replay Files
Replay Files is a SCREAM program function that allows the user to view data
that has cleared out of the display buffer and is stored in files on the hard
drive.
Only data that is stored in .GCF format can be replayed using SCREAM's WaveView
windows.
Raw data, once it has been stored to disk cannot be altered when viewed in SCREAM's
WaveView windows.
Replay mode allows the user to utilize all of the WaveView functions to view
historical data.
NOTE: Replay cannot combine files into new files, nor cut segments of data from
a data file to make a new file.
To use File Replay to view stored historical data in a WaveView window Go to
the Available Streams window and
move the mouse pointer to File and left click on this button .The following
options appear. Move the mouse to scroll down the menu options and highlight
and click on Replay Files.


A new window, opens asking you to select the files for replay.
Go to your data folder.
To get to your data folder:
Use the mouse pointer to click on the Down Arrow icon beside the Look in: window.
Select your directory path by clicking on it.
Use the mouse to click and highlight to choose folders in the window and click
on the open button or double click on them until you reach the location where
your data is stored.
The data files should look similar to the image above.
Use the slider button to scroll through the data files until you find the date
and time of various files you wish to replay.
Use the mouse pointer to highlight a file and click on it to choose the file
and click on the Open button. You can highlight several folders in the range
you want by highlighting either the first or last file wanted and clicking on
it to choose it, then use shift key with the up or down arrow on the computer
keyboard to highlight a section of several files to move into SCREAM to replay.
Once you have selected a file or group of files by highlighting them, click
on the Open button.
The files you chose to view will show in the Available Streams window in the
left and right panes.
The files folder will be highlighted and all files you chose for replay will
be listed with the data streams showing in the right pane pf the Available streams
window.
The Replay Control window will appear on the screen:

You can choose what file to view by clicking on the down arrow and scrolling
down to choose the file you want to view.
![]()
If you files are not large and you have chosen just a few files, you can choose
(All files) and all the files you chose for replay will be fed into the memory
buffer as a group.
![]()
The left and right arrows control the speed the data is fed into the memory
buffer.
The left arrows slow down the speed data blocks are fed in and right arrows
speed up the block data rate up.
1x feeds one data block per 24 seconds and 128x feeds 4 data blocks per second
into the WaveView window.
![]() The pause button stops the data
from being fed into the memory buffer and holds here until the paused button
is pressed again.
The pause button stops the data
from being fed into the memory buffer and holds here until the paused button
is pressed again.
![]() The frame button works only
when the replay pause button is used. While in pause mode, it will feed one
data block into memory and into the WaveView window each time the button is
pushed.
The frame button works only
when the replay pause button is used. While in pause mode, it will feed one
data block into memory and into the WaveView window each time the button is
pushed.
Replay Files Example
The file chosen for replay in the following example is a VERY large file, 15
hours of data in one file. This is a mistake I made when fiddling with the set-up
parameters. For ease finding events of a specific time and having data files
that "fit" in a WaveView window, I recommend the data files be set
to 1 hour in length or no more than 4 hours in length. The data file I chose
for replay has the starting date and time of March 16, 2000 00:00 hours.
To watch data be repoduced in a WaveView window:
Double click on the data stream in the right window pane of the WaveView window
that matches the file you want to view. This will open a WaveView window with
the data stream you want to see. Only the first block of data will show on the
screen.
Choose the corresponding data stream to replay using the Down Arrow and picking
the file in the Replay Control window. If you have only one file chosen or wish
to view all the files into the WaveView window buffer, choose (All files).

The WaveView window will not be paused and you will observe time marching across
the screen with no data stream coming in.
Go to the Replay Control window and observe the Pause button is pressed in.
Click on the Frame button ![]() and
observe a block of data feeds into the WaveView window each time you press the
button. If it does not, you have chosen the wrong file in the Replay Control
window.
and
observe a block of data feeds into the WaveView window each time you press the
button. If it does not, you have chosen the wrong file in the Replay Control
window.
Look at the Available Streams window and observe the End Time change as you
click on the frame button. This is the File the WaveView window is opened to
see.
Go back to the Replay Control window and choose the correct file or double click
on the Data Stream in the Available Streams window to open a new WaveView window
with this data file in it.
If (All FIles) have been chosen all the End Times for each data file will increment but only the one chosen to be opened in a WaveView window will show.
In the Replay Control window, click on the speed up or slow down arrows to
choose a rate to feed data into the WaveView buffer 64x is a good starting rate.
With the correct WaveView window in the foreground, click on the Pause (un-pause
it) button in the Replay control Window and observe data starts feeding in to
view.
You can adjust the time and amplitude controls of the WaveView window as you
prefer and the size of the window as well.
Click on the speed controls to go faster or slower or pause the window to stop
for a time, to take a closer look at a section.
Pausing
Note: if you paused the Replay Control, you must pause the WaveVeiw window or
time will continue to march across the screen with nothing coming in.
Once the WaveView Window is paused you can use the scroll button to move up and down the data stream to get a particular section into view and use all of the WaveView buttons to manipulate the data.
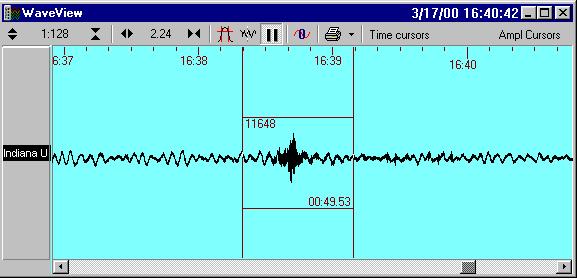
In the example above I ran the ran the Replay Control until I observed this event coming in. I paused both the Replay and the WaveView window to take a better look at this event, an earthquake located off the coast of Northen California, mag. 5.5 is shown above as it was recorded in Bloomington, Indiana. I noted the data and time. Later I ran the GCFinfo program to "cut" this event out of this huge data file and made two new data files containing only this event to use again in Replay Control as an event file stored in .gcf data format and to Upload the event to the Princeton database stored as an event file in .pepp format.
Unpausing
To view the rest of the data "unclick" the WaveView window pause button
FIRST and then "unclick" the Replay Control pause button SECOND. Continue
to use the speed control and WaveView window controls as needed.
Often the null offset button needs to be pushed in the WaveView window to keep the data stream in the range of the window when temperature variations have affected the sensor.
Viewing Files After Replay Loading
back to top
When all files have been run through the Replay Control window, whether all
at once or one at a time, the Replay Control window closes and is no longer
needed.
The data streams are now fed into their respective WaveView Window buffer and
are available to view in a WaveView window at anytime.
Simply "Double Click" on a FILE data stream to view it.
Note:
Use the Pause button in the WaveView window or time will continue to march across
the window as if realtime data is being displayed.
The window must be paused to be able to scroll up and down the data stream.
Another feature is more than one data stream can be viewed in a single WaveView
window, IF the data streams are small AND are in consective time frames or within
the time window of the WaveView display, simply "Drag and Drop" a
data stream into an open WaveView window that already has one in it.
The streams will be "offset" as they are treated as different data
sources. If you want to "combine" data into one stream to view, use
the program GCFinfo to combine the files into a single "new" file
and replay the new file.
Removing Replay Files
To REMOVE data files from the Available Streams window, highlight the data stream
or the file name in the left pane and right click on it. Scroll down to Delete
to remove the file.
Note: this DOES NOT delete the data file stored on the hard drive. It deletes
the data stream that was copied into the WaveView buffer.
See SCREAM'S Help Menu for additional information regarding File Replay.
Getting Real Time Data From the
Internet
The WINDOWS pull down menu in the Available Streams window has
an option that allows you to "Pull Data" from other SCREAM systems
that are connected to the internet. The following proceedure will describe how
you can get other PEPP data streams from systems that have a direct internet
connection such as Indiana University's Data Stream. To get other data streams,
the IP (internet protocol) address of each PEPP computer must be known and the
PORT NUMBER as set in SCREAM's SETUP Network Option MUST must be set to the
same PORT NUMBER and "Recieve Data From Serial Port" MUST BE CHECKED!
"Pulled" data will show up in the Available Streams window and can be used and stored just like data coming in on the serial port. The data recieved is yours to use as you wish.
Click on Network Control in the Windows pull down menu of the Available Streams
window;
A new window will open:
Right-Click on the upper white space and choose add, like this:
Then this window will popup:

type in the dialog box:
129.79.146.66:1568 (this is the IP address of a PEPP system at IU)
Click ok and the IP you typed will appear in the Network Control window.
Make sure that Recieve Data is checkmarked and that the Port number at the bottom is 1568.
The IP address you typed will show in the Network Control window under Server as shown below.
Move the mouse pointer and click on the server you added to highlight it. While
the mouse pointer is inside the highlighted section, RIGHT click to open the
GCFcommand window:
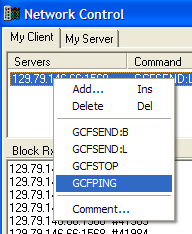
Choose GCFPING:
Click "OK" on the ping window that comes up.
Look in the right window pane of the network Control window and see if
there is a statement that says:
GCFACKN as shown in the example above.
If you get this acknowledgment, CMD: GCFACKN from 129.79.146.66, you can get
our data stream.
If there is no response to the GCFPING request, you cannot get our data because
of the local internet configuration.
RIGHT click to open the GCF command option window and choose GCFSTOP to stop
ping requests from being sent out to this server after trying and getting NO
Acknowledgements.
Often a network security "firewall" prevents the SCREAM program from
sendng and recieving data packets form the network. If you DO NOT get a GCFACKN,
a "firewall" exists between your PEPP computer and the PEPP computer
you are requesting data from.
Check with your network administrator about allowing a port through the firewall
to be opened to the PEPP computer or ask for a direct connection "outside"
the firewall for the PEPP computer.
Another option to achieve getting data packets over the internet is to use a
modem and run through a phone line.
Consult the PEPP help manual for more information about SCREAM's network protocol
and descriptions.
Send an email to requesting help to: tstigall@indiana.edu
If you get an acknowledgment in the right pane, CMD: GCFACKN from 129.79.146.66
Open the GCF command optiion window by RIGHT clicking on the IP address of the server you want data from and
Click on GCFSEND:L
Our data packets will start showing up in the Block Rx Pane of the control
window
Look in the Available Streams window, our data stream should appear after a
moment or two.
The above process can be repeated for as many servers as desired.
The data the SCREAM program recieves over the internet can be treated the same
as data coming in from the serial port. It is yours to treat as your own data.
To remove a server on the Network Control list
Highlight the server you want to remove and RIGHT click to open the GCF command
option window and choose GCFSTOP.
Then, Hightlight the server you want removed from the list and move the mouse
pointer to the Server pulldown window and scroll to choose and highlight Delete.
This removes the sever from the Network Control window.
6/19/01