Introducing
WinQuake 2.5
Background
Windows users currently have two programs available for analyzing seimograms, SWAP and WinQuakes. SWAP is freeware and WinQuakes is free to schools upon registration. Both can be downloaded from the PEPP website. Although the two programs do basically the same thing I highly recommend that both programs be available at each school. Each program has some strong points and some limitations and, after some practice, the user will be able to choose the best tool for what they want to accomplish. This introduction is intended to help the user get started in using WinQuakes to analyze seismic data. WinQuakes can work with data files in either of the following formats: PEPP, SAC, SEED, or PSN (Public Seismic Network).
Loading a file
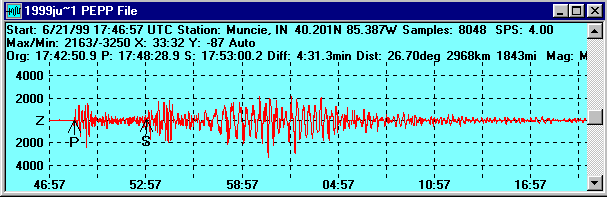
For the purpose of this introduction I'll assume that the user has installed WinQuakes and has data on a removable disk ready to be analyzed (similar instructions apply to Windows 3.1). When the program is started it automatically goes to the Open File window, shown below, and displays the files available in the WinQuakes data folder.
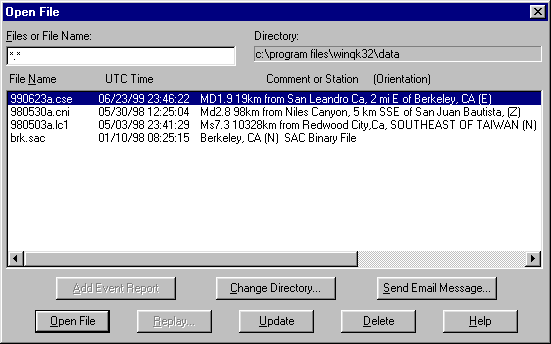
In order to open the files on the user's disk the appropriate directory must be selected.
Click ![]() and
select the directory containing the PEPP files.
and
select the directory containing the PEPP files.
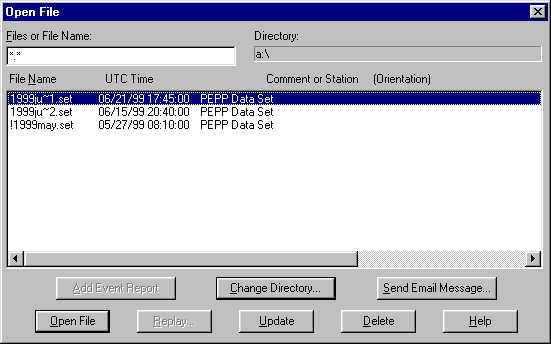
In this example the data for three different earthquakes are available in data sets that were downloded from the PEPP website but only one data set can be opened at a time. Highlight the desired data set and click Open File.
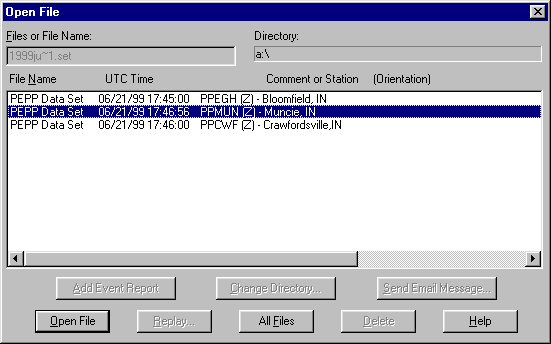
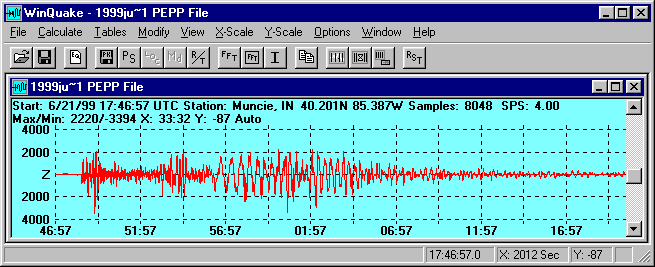
Select a file from the data set and click Open File again. Your open file screen should resemble the one below. ( This example image has been made smaller to save space).
After a file is opened there are
several drop-down menus available that allow the user to contol
how the data is displayed and analyzed. Choose Options and select SEED/SAC/PEPP
Control. 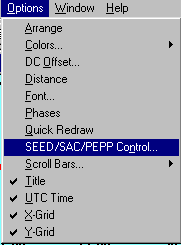
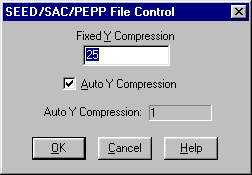
.
Check the Auto Y-Compression box. This allows the program to display PEPP data properly
Adjusting the Window
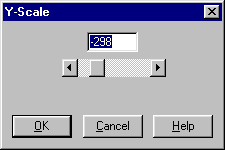
When the program opens a file all data points are displayed in the available window. The amplitude of the display is controlled by the vertical scroll bar or by adjusting the value in the Y-Scale option. A positive value increases the y-scale and a negative value compresses it. It is usually simplest to use the scroll bar on the right side of the screen.
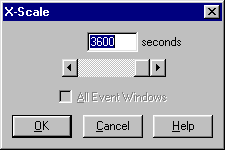
The horizontal scale can be changed
by entering a new value in the X-Scale box or by selecting a region
on the graph. The horizontal axis displays the UT of the data points. The
X-Scale box shows the total number of seconds on the current display.
This can range from 1 second up to the total time in the original sample.
To select a region of the graph, locate the cursor at one side of the desired
area. Double click and drag the vertical cursor to enclose the region of interest.
To return to the original display choose Reset from the View menu
or use the reset button ![]() on the tool bar.
on the tool bar.
Filtering the Data
An important feature of WinQuakes
that is not available on SWAP is the ability to filter data. This process
of filtering is done to eliminate as much "noise" as possible from
the seismogram in order to clearly identify events and pick out phases. If
your data looks very noisy and cluttered beyond use, it still may contain
valuable information that can be identified after filtering. Before the data
can be filtered the file must first be analyzed to determine the frequency
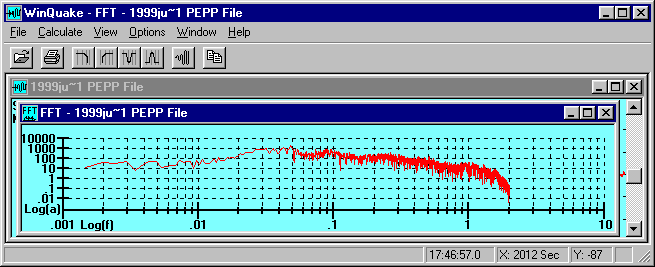
content. Applying a Fast Fourier Transform (FFT) to the data does this. From
the Calculate menu select Full FFT, or use the ![]() button on the toolbar.
button on the toolbar.
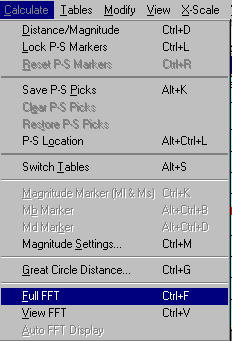
The FFT will be calculated and
a graph will show the frequencies of the vibrations recorded by the seismometer.
Your screen will look somewhat like the one below. Note that the menu bar
and tool bar buttons have changed. There is a new Calculate menu used
to access the filters described next. If you choose View FFT or
![]() , the FFT will be shown but the filter menu
will not be accessible.
, the FFT will be shown but the filter menu
will not be accessible.
Once the FFT has been calculated, filters can be applied to eliminate unwanted frequencies. WinQuakes has four different filters: high pass, low pass, notch and band pass. Each filter eliminates different frequency ranges and sometimes it's desireable to apply more than one get the "cleanest" seismogram.
high
pass-![]() used to eliminate low frequencies.
The lowest acceptable frequency is entered and the filter passes all frequencies
higher than the cutoff.
used to eliminate low frequencies.
The lowest acceptable frequency is entered and the filter passes all frequencies
higher than the cutoff.
low
pass-![]() used to eliminate high frequencies.
The highest acceptable frequency is entered and the filter passes all frequencies
lower than the cutoff.
used to eliminate high frequencies.
The highest acceptable frequency is entered and the filter passes all frequencies
lower than the cutoff.
notch-![]() used to eliminate a band of frequencies.
A high frequency and a low frequency are entered and the filter removes all
frequencies between the two limits.
used to eliminate a band of frequencies.
A high frequency and a low frequency are entered and the filter removes all
frequencies between the two limits.
band
pass-![]() used to eliminate frequencies above
and below set limits. A high frequency and a low frequency are entered and
the filter passes all frequencies between the two limits. Other frequencies
are eliminated.
used to eliminate frequencies above
and below set limits. A high frequency and a low frequency are entered and
the filter passes all frequencies between the two limits. Other frequencies
are eliminated.
Experienced analysts can probably get the best results possible from the data relatively quickly but most of us are novices and will have to go through a process of trial and error to begin to get useful results. Use the following procedure to filter your data and you will begin to get a feel for how the process works:
1. Open a seismogram in WinQuakes and examine the seismograph. With experience you may be able to gain some clues about which filter to use.
2. From the Calculate menu select Full FFT, or use the button on the toolbar . The FFT will be calculated and a graph will show the frequencies of the vibrations recorded by the seismometer.
3. Examine the FFT spectrum and try to determine the range of frequencies in your data that are most likely to have come from an earthquake.
4.
Select a filter from the new Calculate menu or select the appropriate
button from the tool bar.
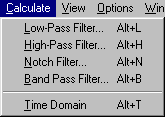
It's probably not a bad idea at first to try a band pass filter and experiment
with the limits to see what happens. For this example I've set the filter
at the indicated limits.
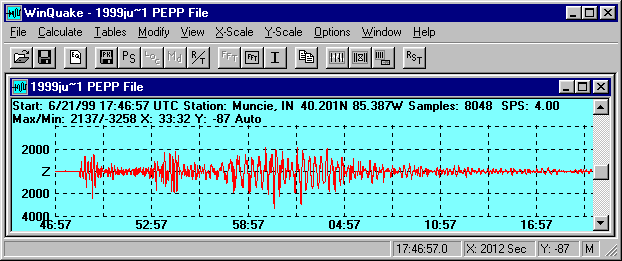
5. After applying the filter you
will get a new FFT showing the filtered spectrum. You will now need to do
a reverse FFT. Select Time Domain from the Calculate menu or
use the ![]() button. This will produce the seismogram again with but with some
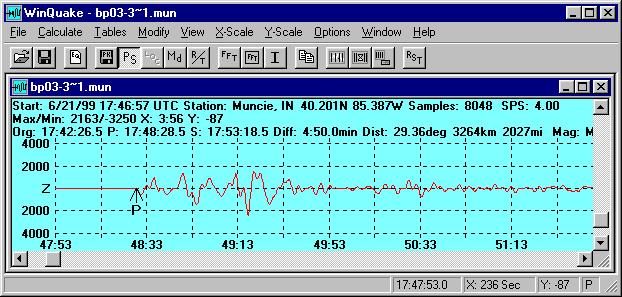
frequencies removed. The result of using the filter is shown below. Although
the change is not dramatic, some of the higher frequencies have been removed.
button. This will produce the seismogram again with but with some
frequencies removed. The result of using the filter is shown below. Although
the change is not dramatic, some of the higher frequencies have been removed.
Once the reverse FFT has been applied
you can't undo it. If you want to try something different with the original
data you will need to close the file and reload it. However you can continue
to work with the filtered seismogram. Note that the ![]() button
is blanked out in the screen above. In order to do additional filtering you
will first need to close the FFT Window. (This may be hidden under the seismogram).
The
button
is blanked out in the screen above. In order to do additional filtering you
will first need to close the FFT Window. (This may be hidden under the seismogram).
The ![]() button will
now be active and the process can be repeated.
button will
now be active and the process can be repeated.
Remember that the data that was loaded originally has been modified. The new seismogram should be saved under a new file name in order to preserve the original data as well as the filtered data.
WinQuakes does not provide PEPP format for saving files so files saved in WinQuakes can't be uploaded to Princeton.
Locating Phases
The process of locating phases on the seismogram usually starts with identifying the arrival of the P wave and the S wave. WinQuakes lets the user pick both arrivals and then uses these choices to determine additional information about the event.
After opening the desired seismogram,
select the ![]() button from the tool bar. Arrows labeled P and
S will appear on the seismogram and a new line will appear in the text heading
at the top. This line shows the P and S arrival time from the current locations
of the pointers and information such as origin time and distance based on
these locations. The values shown will change as the pointers are moved.
button from the tool bar. Arrows labeled P and
S will appear on the seismogram and a new line will appear in the text heading
at the top. This line shows the P and S arrival time from the current locations
of the pointers and information such as origin time and distance based on
these locations. The values shown will change as the pointers are moved.
First locate the approximate Pwave arrival. Look for a distinct change in the seismogram above any background noise. Locate the P arrow at your arrow best estimate and then repeat the process for the S wave. Remember that the S wave arrival is usually a stronger pulse arriving up to several minutes after the P wave. The exact detemination of the arrival time is not critical at this point. Your seismogram should resemble the one shown below (small, for illustration only- a larger window would be used for your work).
.
The P and S picks are only estimates at this point. Now choose Lock P-S Markers from the Calculate menu. This retains the relative positions of the pointers as the screen is expanded. The markers can still be moved, however, to pick new arival times. In order to determine the arrival times more precisely select a region around the chosen P arrival and expand the view. Relocate the P wave marker to the selected P wave arrival. An example is shown below.
Repeat the process for the location of the S wave arrival. The text line will now display the new P and S arrival times and the calculated origin time, P - S interval, and distance to the event in degrees, kilometers and miles. After picking the arrival times the seismogram may be returned to its original scale by choosing X-Scale and moving the slider all the way to the right.
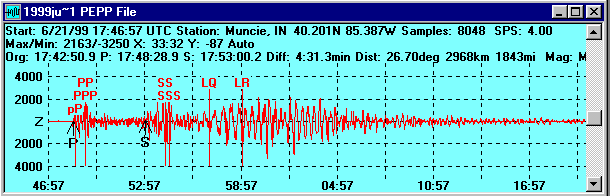
WinQuakes
can also be used to help identify other phases that may be present in the
seismogram. Once the P and S arrivals have been chosen, other possible phases
can be shown by selecting the ![]() button from the tool bar. This will
produce a display like the one shown next.
button from the tool bar. This will
produce a display like the one shown next.
Selecting the ![]() button
from the tool bar shows a table of arrival times for the indicated
button
from the tool bar shows a table of arrival times for the indicated
phases.
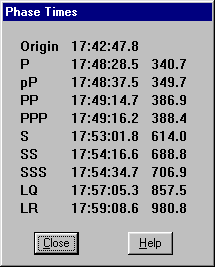
This table corresponds to the phases shown above.
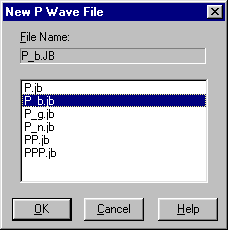
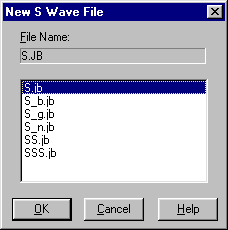
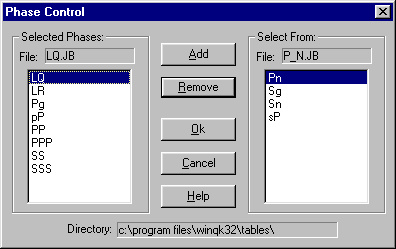
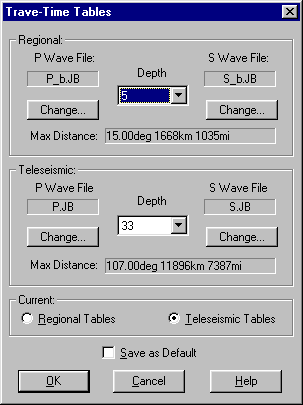
In order to determine the possible phases and arrival times WinQuakes use two tables and sets of files that must be selected correctly in order for the results to be reasonably reliable. Choosing Tables from the menu produces the following choices for selecting the best time-travel tables to be used in identifying possible phases:
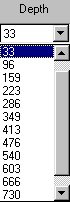
1. First the appropriate table, Regional or Teleseismic, must be selected.
2. Next the approximate depth of the event must be choosen.
3. Finally there is a choice of possible phases to be displayed from different possible P and S wave files.
Switching between Regional and
Teleseismic tables can be done quickly using the
![]() button
button
if the
other selections have been set. The phase control button ![]() brings
up the phase
brings
up the phase
control menu which allows phases to be added or removed from phase files.
Obviously the reliability of the phase identifications depends upon several
factors and should not be depended upon until the user has some experience
in analyzing seismograms.